WxImpact: Minneapolis,Minnesota

http://paularmstrongdesigns.com/photos/photos/minneapolis2.jpg

http://photos.igougo.com/images/p261936-Minneapolis_MN-Minneapolis_Sculpture_Garden.jpg
Geography
Minneapolis, located in Southeast Minnesota, along with Saint Paul is known as one of the “Twin Cities” [1]. It is the largest city in its state and one of the largest in the Midwestern United States, covering an area of 142 square kilometers [2]. The land is relatively flat [3], and its most notable geographic feature is water. Aptly known as the City of the Lakes, Minneapolis contains 22 such bodies of water within city limits [4]. These many lakes are the lasting effects of glaciers passing over the area long ago [2]. Along with many other water features such as creeks, wetlands, and a waterfall, the city has a special feature called the Chain of Lakes. Protected and preserved by the city’s park system, the Chain of Lakes contains Lake Calhoun, Cedar Lake, Lake Harriet, Lake of the Isles and Brownie Lake. This is a popular spot for residents to relax and tourists to visit [3]. In addition to its impressive number of lakes, Minneapolis also contains other significant water features. The Mississippi River, the largest river in North America, passes through the city from North to Southeast [3]. Another interesting feature of the city is that Minneapolis is situated on the 45th parallel, the half way point in the Northern hemisphere between the equator and the North Pole [5].
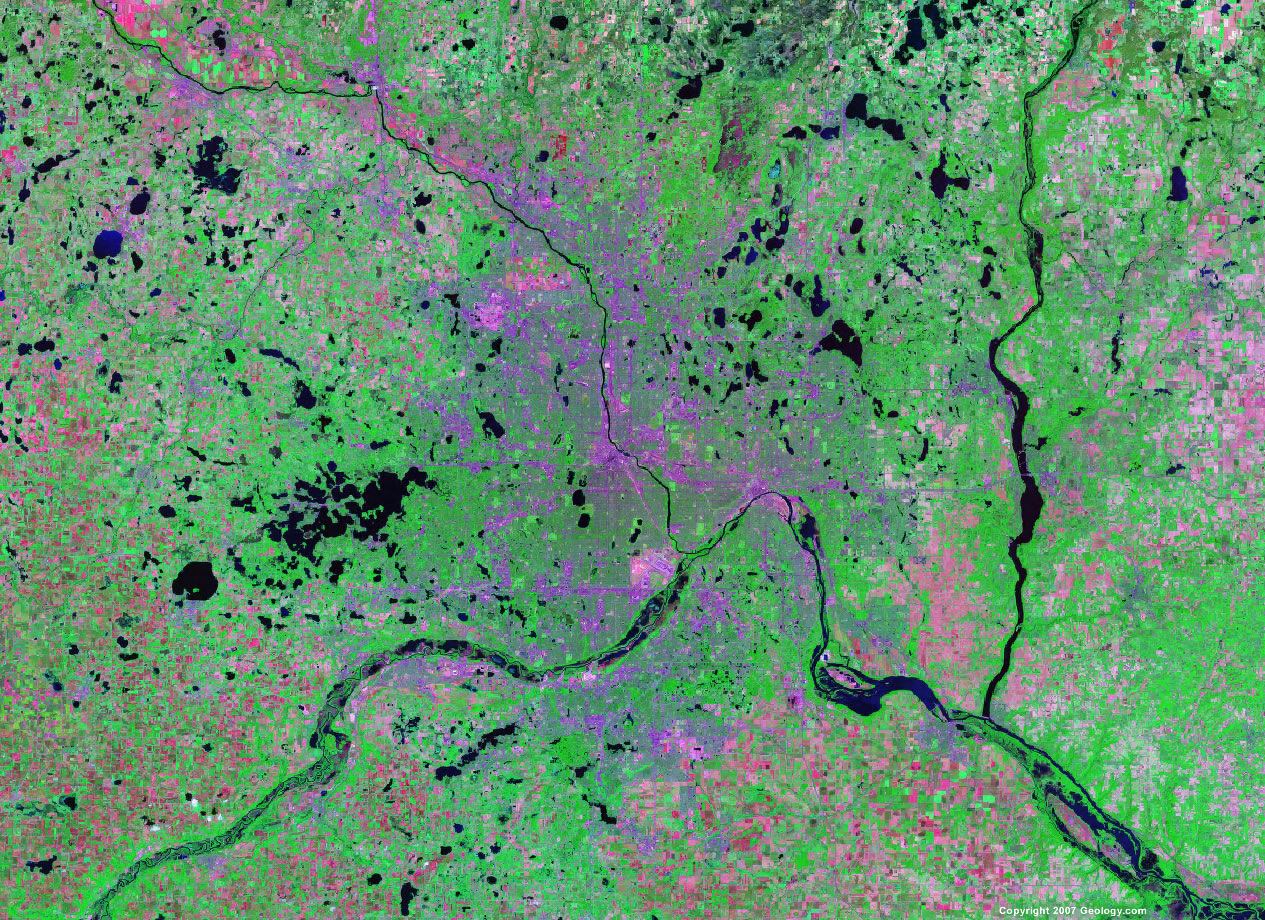
The Chain of Lakes in Minneapolis, as shown in this map, is part of the Grand Round Scenic Byway, a stretch of public roads. This geographic satellite map highlights the many water features of Minneapolis [7].This geographic satellite map highlights the surrounding lands with noteworthy views and significance[6].
[1] www.emporis.com/en/wm/ci/?id=101331
[2] http://encarta.msn.com/encyclopedia_761572218/Minneapolis.html
[3] http://www.minneapolisparks.org/default.asp?PageID=4&parkid=235
[4] www.ci.minneapolis.mn.us
[5] http://www.wurlington-bros.com/Museum/45th/Mpls.html
[6] http://www.minneapolisparks.org/grandrounds/home.htm
[7] http://geology.com/satellite/cities/minneapolis-and-st-paul-satellite-image.shtml
[8] http://encarta.msn.com/encyclopedia_761575600/Mississippi_(river).html
Ecology

 Chaparral
 Alpine
 Deciduous Forest
 Desert
 Desert-scrub
 Grasslands
 Rainforest
 Savanna
 Taiga
Taiga
 Tundra
Minneapolis is situated in an area where the main ecosystem is temperate deciduous forest [1]. Approximately 13,328 sq. miles of its total 84,372 sq. miles is classified as deciduous forest [2]. It is because of this that it is important to remember that most of the city of Minneapolis is a major metropolitan area and the forests are mostly contained in parks, recreational or preservation areas (See Land Use Map). Animals common to Minneapolis include chipmunks, coyotes, white-tailed deer, fishers, minks, and groundhogs [3]. The vegetation or plant life found in Minneapolis includes such plants as Common Lime, Lady Fern, Northern Arrowwood, Pecan, Shagbark Hickory, White Birch, White Oak, Peat Moss, Granite Moss, Interrupted Fern, and Beard grass [4&5]. Below are pictures of some of the plants typical of a deciduous forest as well as some animals of Minneapolis.
|

Lady Fern [6]
|

Beard Grass [7]
|
|

Groundhog seen on the banks
of the Mississippi River [8]
|

White-tailed deer [9]
|
[1] http://www.blueplanetbiomes.org/world_biomes.htm
[2] http://landcover.usgs.gov/nlcd.php
[3] http://www.dnr.state.mn.us/mammals/index.html
[4]http://www.blueplanetbiomes.org/deciduous_plant_page.htm
[5] http://www.questia.com/PM.qst?a=o&d=6753842
[6] http://www.blueplanetbiomes.org/deciduous_plant_page.htm
[7] http://www.biosurvey.ou.edu/okwild/images/beardgrass.jpg
[8] http://en.wikipedia.org/wiki/Minnesota
[9] http://www.dnr.state.mn.us/snapshots/mammals/whitetaileddeer.html
Climate
General:
The climate of Minneapolis, MN is typical of that of other cities in the upper midwestern United States characterized by bitterly cold winters and hot, humid summers. Minneapolis experiences a number of significant weather related events including, but not limited to, snow, rain, fog, thunderstorms, sleet, and tornadoes[1]. Minneapolis has numerous lakes in its general vicinity but a lack of large bodies of water to moderate air temperature allows it to be affected by cold air masses from Canada. This, among other factors, have led to Minneapolis having the coldest average temperature of any major metropolitan area in the continental U.S![2]
Average Rainfall for Average Temperature for
Minneapolis-St.Paul Minneapolis-St.Paul


[4]
Records:
Wettest Year - 1911 - 41.15 inches of precipitation
Dryest Year - 1910 - 11.54 inches of precipitation
Hottest Temperature on Record - 108 degrees Farenheit
Lowest Temperature on Record - -41 degrees Farenheit [3]
As you can see, Minneapolis recieves a variety of different weather related events, and their climate, like much of the upper midwest, can vary significantly from year to year [1]
[1] http://climate.umn.edu/doc/prelim_lcd_msp.htm
[2] http://www.ncdc.noaa.gov/oa/climate/online/ccd/nrmavg.txt
[3] http://www.weather.com/outlook/travel/vacationplanner/wxclimatology/monthly/USMN0503
[4] http://www.rssweather.com/climate/Minnesota/Minneapolis-St.Paul/
Population Characteristics for Minneapolis

Total population- 369,051
Male- 186,350
Female- 182,701
Median Age(years)- 33.6
Under 5 years- 28,139
18 years and over- 286,150
65 years and over- 30,202
Demographics
One race - 357,333
White- 252,868, 73.9%
Black or African American- 68,722, 12.4%
American Indian and Alaska Native- 4,769, 0.8%
Asian-18,221, 4.4%
Native Hawaiian and Other Pacific Islander- 102, 0.1%
Some other race- 12,651, 6.3%
Two or more races- 11,718, 2.0%
 Hispanic or Latino (of any race)- 32,754, 14.8%
Social Characteristics –
Average household size- 2.25
Average family size- 3.14
Population 25 years and over- 237,555
High school graduate or higher- 87.1
Bachelor's degree or higher- 40.4
Civilian Vetrans (civilian population 18 years and over)- 21,164
Disability status (population 5 years and over)- 45,886
Foreign born- 54,553
Male, Now married, except separated (population 15 years and over)- 53,762
Female, Now married, except separated (population 15 years and over)- 49,223
Speak a language other than English at home (population 5 years and over)- 65,756
Household population- 349,731
Economic Characteristics –
In labor force (population 16 years and over)- 215,926
Median household income(in 2006 inflation-adjusted dollars)- 43,369
Median family income (in 2006 inflation-adjusted dollars)- 55,361
Per capita income (in 2006 inflation-adjusted dollars)- 27,487
http://factfinder.census.gov/servlet/ACSSAFFFacts?_event=&geo_id=16000US2743000&_geoContext
Land Use in Minneapolis
Minneapolis’ 54.9 square miles of land are utilized for a wide variety of uses [1]. Much of the land in this city is used for residential purposes. On average, there are 6,789 people per square mile of land in Minneapolis [1]. While most of the land is residential, as can be seen in the city’s Metropolitan Council’s illustration (please see below for link to the pdf file), land in Minneapolis is used for commercial and industrial purposes, for office space, for institutional use such as museums, universities and colleges, hospitals, and churches, and some land is set aside sports facilities as well [2]. Minneapolis is home to Minnesota’s largest sport stadium, the Metrodome [3]. Another notable use of land in the city is parks. The city has over 150 parks in its borders [4]. Minneapolis also contains one of the two terminals of the Minneapolis/St. Paul Airport [5]. While these are some of the most notable uses of land, the Metropolitan Council’s information also shows land in the city is used also for agriculture and mining, while some land is still to be developed. The Council also notes that, like any successful urban area, Minneapolis uses some of its land for roadways and railroads to foster efficient transportation.
 Minneapolis Land Use.pdf
Click to download and view the Metropolitan Council's diagram detailing various types of land use in Minneapolis from the year 2000.
As these pictures demonstrate, land in Minneapolis is used for residential purposes, parks, and commercial and industrial use, and for office space, among others.
Photos provided by http://www.city-data.com/city/Minneapolis-Minnesota.html


Topography of Minneapolis

Courtesy of www.thudscave.com/petroglyphs/pdf/mn_elevation.pdf
Minneapolis expands 54.9 sq. miles of Minnesota and is made up of a relatively flat terrain, shown above in the topography map. The city of Minneapolis hosts major bodies of water located throughout the city, including Lake of the Isles and the Mississippi River [1]. It's latitude is located at 44.96N and longitude at 93.27 West [2]. The exact measure of the 45th parallel lies just west of the Minneapolis city limits at 888 feet about sea level [3]. Minneapolis's average elevation is 820 feet above sea level [2]. The highest elevation within the Twin Cities area is at the Prospsect Park Water Tower, which is located in the five acre Tower Hill Park [4]. There are twenty-two natural lakes within the 54.9 sq. miles of the city. The Mississippi River is located just east of the downtown area, next to the Falls of Saint Anthony, and then continues south into the Minnesota River [1]. The Falls of Saint Anthony is a thirty-two foot cascade of water that was founded in 1680 and is responsible for the birth of Minneapolis [5].
[1] http://encarta.msn.com/encyclopedia_761572218/Minneapolis.html
[2] http://www.city-data.com/city/Minneapolis-Minnesota.html
[3] http://www.wurlington-bros.com/45th/Mpls.html
[4] http://www.mnhs.org/about/publications/planner/Spring1998.pdf
[5] http://travel.yahoo.com/p-travelguide-3502790-falls_of_st_anthony_minneapolis-i
Transportation
Minneapolis, Minnesota has great means of transportation. This location is known for its airport, its bus system, railways, waterways, and highways.

The Minneapolis- Saint Paul (MSP) Airport is the biggest of the northern part in the midwest. Usual weather conditions allow for few flight delays and comfortable traveling while flying. The Minneapolis airport is cross listed with the airport in St. Paul because it stretches across the Mississippi River from St. Paul. It’s the largest airport for Northwest Airline company planes, which accounts for 80% of their flights. Like most airports, the MSP is linked to many other forms of transportation in Minneapolis. This airport provides shuttles to take you around the airport, as well as limousines or taxis to take you to your desired destination after you land. Not only does Minneapolis have an incredible airport, this area has avery useful bus system as well. Before the Metro Transit System, it was first called Twin City Rapid Transit, because of the two cities it adjoined. Now with a shorter name, this bus system is widely used in both cities, along with a light rail system, and a freight railroad, under the. Both systems are incredibly successful in commuting people and goods to various destinations. Water transportation is also helpful in transporting goods. From Minneapolis, barges haul various products down the Mississippi River. Importing and exporting goods also come by way of the Atlantic Ocean. Above all, most people in the city commute by their cars. Major highways are I-35, I-90, and I- 94 in order to get to work, and run miscellaneous errands. One major disaster was the Mississippi River Bridge Collapse in 2007, causing many cars and buses to fall into the river. This was definitely a memorable and devastating tragedy. Overall, Minneapolis' transportation systems are heplful and efficient. It has worked well for years, and will continue to enable transportation in this area.

The new I-35W bridge over the Mississippi River in Minneapolis will open by Dec. 24th, 2008.
[1] http://www.dot.state.mn.us/ofrw/waterways.html
[2] http://www.mspairport.com/msp/maps_guides/default.aspx
[3] www.wikipedia.com/www.wikipedia.com/
[4] http://www.dot.state.mn.us/passengerrail/onepagers/northstar.html
[5] www.ultimatetaxi.com/hotel/images/minneapolis.jpg
Economy
Minneapolis also known as the “twin city” has one of the most stable economies. In this city there are sixteen fortune 500 corporations. Corporations like Cargill, Northwest Airlines, 3M, Honeywell, Weyerhaeuser, and Medtronic. Also, Minneapolis is home for thirty fortune 1,000 companies. Sears and McDonalds are just two of the thirty companies that chose Minneapolis as a place of business.
The twin city is known for its manufacturing. There is a estimated 202,700 workers employed as manufacturers, working in areas like electronics, milling, machinery, medical products, food processing, and graphic arts. More than 82,000 people work in milling, but the food-processing industry is what kept everything stable. “The food-processing industry was historically the mainstay of the area's economy and is still represented by General Mills, Land O'Lakes, Pillsbury, International Multi-foods, and others.”
Also, Minneapolis has a great high-technology industry. “With the University of Minnesota and other colleges and technical schools providing applied research and well-trained scientists and engineers, one of the largest concentrations of high-technology firms in the nation—more than 1,300—developed in metropolitan Minneapolis-Saint Paul.”
|
Data Series
|
Back
Data
|
Aug
2007
|
Sept
2007
|
Oct
2007
|
Nov
2007
|
Dec
2007
|
Jan
2008
|
|
Labor Force Data
|
|
Civilian Labor Force (1)
|
|
1,865.3
|
1,858.3
|
1,862.8
|
1,860.9
|
1,856.9
|
|
|
Employment (1)
|
|
1,788.4
|
1,771.7
|
1,788.0
|
1,789.0
|
1,774.0
|
|
|
Unemployment (1)
|
|
76.9
|
86.6
|
74.8
|
72.0
|
82.9
|
|
|
Unemployment Rate (2)
|
|
4.1
|
4.7
|
4.0
|
3.9
|
4.5
|
|
[1] http://www.bls.gov/eag/eag.mn_minneapolis_msa.htm
[2] http://www.city-data.com/world-cities/Minneapolis-Economy.html
[3] http://www.city-data.com/us-cities/The-Midwest/Minneapolis-Economy.html
Minneapolis, MN Weather
Blizzards
Jenny Koys
To some, thoughts of Minneapolis go hand in hand with images of brutal wind and snow. Blizzards are one form of severe weather that is common to this city. While the continental United States experiences an average of approximately 11 blizzards annually [1], some parts of the country fall victim to this weather with much more frequency than others. Blizzards are worst in the upper plains of the United States, where Minneapolis is located [1]. Minneapolis is more likely to experience a blizzard than many other cities in the United States. Each year there is a 54 percent probability that a blizzard will hit Minneapolis [1]. This susceptibility to blizzards has been realized throughout the city’s history. Between 1959 and 2000, Hennepin County (in which Minneapolis is located) reported between 31 and 40 occurrences of blizzards [2]. The state of Minnesota experiences a blizzard once a year on average; most of these blizzards occur between November and March, but blizzards typically can begin to appear in October and generally cease in April [3]. So, while blizzards are generally thought of as winter weather, they can also occur during fall and spring months. As blizzards are not common to most parts of the country, Minneapolis’ more frequent experience with this form of severe weather is fairly unique. Because it lies in a region which is often affected by blizzards more severe than storms other areas deal with, this region is arguably better able to handle this weather. John Bray, a spokesman for the Minnesota Department of Transportation, attests to the abilities of the state to handle blizzards. As snow plow drivers in Minnesota go through a lengthy training and certification program, Bray states, "We have the most highly trained operators, they're up to anything that could hit us weather wise," [13]. A previous Minneapolis resident who has lived in and several cities and now lives in the Chicago area agrees that the city is better able to handle severe winter weather than other locations. "In Minneapolis, the streets are salted or sanded before the storm even hits. They get on it much quicker than other cities," he said [14].

Minneapolis citizens are
better acquainted with blizzards
than much of the country. [7]
Blizzard development occurs in two different ways, and the blizzards produced are called either Alberta Clipper or Colorado Low blizzards. The presence of an extratropical cyclone, a low pressure system, is needed for blizzards to develop [2]. Both the Alberta Clipper and Colorado Low blizzards start with low pressure cyclones. The other factors that lead the development of a Great Plains blizzard are a mass of cold air present over Canada, the Rocky Mountains channeling cold air from Canada and blocking warm air from the Pacific, moist air provided by the Gulf of Mexico (this leads to cloud and precipitation development), and a contrast between the low pressure system (the Alberta Clipper or Colorado cyclone) moving across the country and high pressure coming south from Canada [2]. This contrast between pressure systems creates a strong pressure gradient, which leads to strong, fast winds. The ingredients that define a blizzard are these winds that have a minimum speed of 35 miles per hour (30 knots), and falling or blowing snow that reduces visibility to less than a quarter mile for a period of at least three hours. Cold air is also an important part of a blizzard, however, no specific temperature criteria is used to define a blizzard [17].
Blizzards occur within extratropical cyclones. On the Great Plains, Alberta Clipper cyclones or Colorado cyclones are the extratropical cyclones in whose circulations these storms take place [2]. Alberta Clipper cyclones form due to the presence of waves in the jetstream over Canada. Once formed, they travel southeast across Canada and into the Great Plains [2]. These cyclones generate blizzards that produce two to five inches of snow. This snow is light and dry, which makes it easily windblown. Thus, Alberta Clippers can lead to the development of ground blizzards, which are blizzards solely caused by windblown snow [17]. Blizzards caused by Alberta Clippers are characterized by very cold temperatures, with winds blowing northeast. These storms die out quickly, lasting one to two days. [17]
Just as Alberta Clipper cyclones are caused by waves in the jetstream, Colorado cyclones form when a wave in the polar jetstream moves over the Rocky Mountains, causing the divergence which leads to the formation of a low pressure system [2]. The winds in the extratropical cyclones (both in Alberta Clippers and Colorado cyclones) pull cold air from Canada and warm, moist air from the Gulf of Mexico. Because Colorado cyclones form closer to the Gulf than Alberta Clippers, they draw more air from the Gulf of Mexico, which leads to warmer temperatures and more snow in their associated blizzards [17]. A trough of warm air aloft, called a trowal, forms, and this is the source of snowfall in these blizzards. Colorado cyclones lead to Colorado Low blizzards that dump ten to twelve inches of snow; often snowfall is even greater than ten to twelve inches. The winds in these blizzards, which blow northwest, are typically stronger than those of Alberta Clipper blizzards [17]. These strong winds can lead to the buildup of massive snowdrifts. Colorado low blizzards also move more slowly than Alberta Clipper Cyclones, lasting three to five days. The Colorado Low blizzard is the “traditional” blizzard that is first brought to mind when considering this type of weather phenomenon [17].
Even before either an Alberta Clipper or Colorado cyclone forms, very cold air and high pressure must already be present over Canada for a blizzard to occur [2]. Cold air develops in Canada due to the long nights and short hours of daylight which lead to radiational cooling [17].
Due to their frequency and severity, blizzards have had lasting impacts on Minneapolis and Minnesota. Citizens have learned to recognize how dangerous these storms can be, and are used to hearing about an average of three reports of death due to blizzards in their state each year [3]. The effects of weather events such as Halloween Blizzard of 1991 led the region to make technical advances in transportation, such as building and maintaining roads better, which has contributed to a recent decline in blizzard fatalities [3]. A single event like this has many impacts on the region. For example, the Halloween Blizzard storm led to power outages that lasted days, $11.7 billion of damage in southcentral and southeast Minnesota, and 20 deaths in the state due to either traffic accidents or heart attacks that came on while digging out after the blizzard hit [15]. Since the city of Minneapolis is home to many commericial enterprises and offices, a loss of power could lead to a large loss of productivity and profit. Additionally, transportation difficulties conceivably not only prevent people from being able to get to work, but also impede people from going out to spend money, further hurting businesses. This, in addition to the costs of damage, cause a lasting economic impact on the city and region. People who live in this area are less free to move around as they would like when blizzards hit. The Minnesota Dpeartment of Transportation recomends not travling at all during severe storms, unless it is "absolutely essential" [13]. When a blizzard hits, people's daily lives are absolutely interrupted. Due to Minneapolis’ higher than normal rate of blizzard experience, in comparison with the rest of the country, its citizens are likely more knowledgeable about blizzard safety tips. For example, knowing to carry a winter storm survival kit, to keep items to free a car from trapped snow (such as sand or a shovel) inside a vehicle, to stay inside a car to prevent getting lost in snow, and to carry a cell phone [4] is knowledge that could likely save a citizen of Minneapolis’ life. "People in Minneapolis seem to know more about blizzard safety," commented a past resident, "They try to be prepared. A lot of people have sand, blankets, or even candles in their car in case they get stuck in a blizzard," [14].
Case Study: The Armistice Day Blizzard of 1940
Jenny Koys

An image from one of the strongest blizzards to ever hit the Minneapolis region.
This storm dumped 16.7 inches of snow on Minneapolis and St. Paul alone , and winds led to the
buildup of snowdrifts up to 20 feet tall [10].
On November 11, 1940, Minneapolis, along with an area ranging from Kansas to western Wisconsin, was hit by a blizzard that would become one of the most memorable and famous in the region’s history [5]. Although the blizzard would eventually dump 26 inches total on central Minnesota and lead to temperatures of 24 degrees below zero [9], the holiday (which is now known as Veteran’s Day) began mildly. Temperatures started in the 40’s and 50’s (degrees Fahrenheit), but soon dropped to frigid single digits [6]. These low temperatures are characteristic of blizzards; however there is no specific temperature in defining a blizzard. The winds that accompanied the storms, however, were well above the minimum criteria of 35 miles per hour (30 knots) for blizzard winds. The Armistice Day Blizzard’s winds raged at speeds from 50 to 80 miles per hour, and their force led to the buildup of 20 foot tall snowdrifts [5]. These winds of hurricane strength slammed through the region. One newspaper dubbed them “winds of hell” [7]. As the newspaper description implies, the effects of this storm were devastating. The Armistice Day Blizzard was one of the deadliest blizzards the region Minneapolis is located in has seen; while estimates tend to vary, about 49 people died in the state of Minnesota alone, while the blizzard claimed approximately 150 lives overall [7].
The Armistice Day Blizzard was a slow moving storm that intensified [11]. Thus, this storm, with its fast winds and large amounts of snowfall, would be classified as a Colorado Low blizzard. In this particular storm, there was very low barometric pressure; mercury was measured at less than 29 inches [6]. While Colorado lows often exceed their range of ten to twelve inches of snow, this blizzard's snowfall went far beyond that range. Additionally, while strong winds are characteristic of these storms, the winds in the Armistice Day Blizzard were exceptionally strong. As noted before, the winds raged at speeds more typical of hurricanes than blizzards. Although blizzards are familiar to this region, storms of this severity do not occur frequently.
While the blizzard was devastatingly strong, its effects were exacerbated by lack of forecast. The Armistice Day blizzard took the region by surprise. Because the day started out with warm temperatures, many of the fatalities occurred because people froze to death, having gone outside without enough clothing to withstand the frigid temperatures and rapid winds [7]. Many of the people who died were hunters who had gone out earlier in the day, not anticipating the tragic change in the weather [10]. In 1940, weather prediction was certainly not on the same level that it is today. Weather satellites and radar were not used at the time of the Armistice Day Blizzard [8], but this was not the only reason for the failure to predict the blizzard. At the time, weather forecasting for the entire region was directed by a Chicago office [6]. However, the Chicago office was not watching the blizzard’s “explosive development” as it developed early on November 11; the office was not staffed overnight [7]. Hence, Minneapolis and every other area hit by the storm received no warning from meteorologists about the dangerous severe weather heading their way.
Enraged over the loss of life that could have been prevented by better forecasting, people demanded change. The Chicago office began to operate 24 hours a day [7]. Had this been the case before, the storm may have been noticed by weather officials. Another change was made in redistributing forecasting responsibilities to regional centers, as opposed to only the Chicago office. This was done in order to be able to provide more timely and accurate predictions that the Armistice Day Blizzard had taught the region could be incredibly valuable in terms of lives saved [6]. With more advanced technology, such as satellites and radar, along with better organization and around the clock weather monitoring, blizzards such as these can be predicted better today than in 1940. However, even today severe winter storms can be unpredictable [16].
In addition to the loss of life, the blizzard also affected transportation. Snow was piled everywhere, and train tracks were no exception. The Armistice Day blizzard is blamed for a train crash that occurred in Minneapolis [7]. As one can imagine, such huge buildups of snow that could derail a train would also make much other transportation in this region impossible. Without proper supplies of food, for example, a person trapped by so much snow would have had a difficult time surviving.
The massive snow dumped by the blzzard impeded
transportation and led to this trian crash in Minneapolis [7].
The Armistice Day Blizzard was a momentous event. The city of Minneapolis and other affected places were shaken by the disastrous force of this weather system. The Minnesota Climatology Office ranks this storm as the #2 top weather event of the 20th century [10]. It had a lasting impact and remains in the collective memory of the people of the affected region as one of the most severe weather tragedies many people have ever experienced.
[1] https://www.bsu.edu/news/article/0,1370,-1019-4447,00.html
[2] Rauber, Walsh & Charlevoix, Severe and Hazardous Weather, second edition (2002).
[3]http://www.co.st-louis.mn.us/slcportal/SiteMap/HomePage/Departments/Sheriff/EmergencyManagementDivision/EmergencyManagementNaturalandTechnologicalH/EmergencyManagementBlizzards/tabid/882/Default.aspx
[4] http://weathereye.kgan.com/expert/blizzard/WinterSafe.html
[5] http://www.crh.noaa.gov/mkx/climate/big.php
[6] http://www.crh.noaa.gov/arx/events/armistice.php
[7] http://minnesota.publicradio.org/display/web/200011/10_steilm_blizzard-m/
[8] http://weatherstories.ssec.wisc.edu/stories/armistice_day/weather.html
[9] http://www.prairiepublic.org/features/riverwatch/news/forum/11_13_05.html
[10] http://climate.umn.edu/doc/journal/top5/numbertwo.htm
[11] http://climate.umn.edu/doc/historical/winter_storms.htm
[13] http://www.msnbc.msn.com/id/24039925/
[14] Daniel S. Rio, April 13, 2008 Interview.
[15] http://www.crh.noaa.gov/arx/events/halloween91.php
[16] www.gov.ns.ca/emo
Lightning
John Langan

(11)
Lightning Photographer in Minneapolis, Minnesota
Lightning is a giant discharge of electricity accompanied by a brilliant flash of light occurring during a thunderstorm (6). The spark can reach over five miles in length, raise the temperature of the air to hotter than the sun's temperature, and contain a hundred million electrical volts. Lightning occurs when an electrical charge is built up within a cloud. When a large enough charge is built up, a large discharge will occur and can be seen as lightning (6).
Types of lightning
- 80% of lightning strikes occur as in-cloud lightning (5). It is lightning within a cloud and is sometimes called intra-cloud or sheet lightning.
- Cloud to ground lightning is when a bolt of lightning from a cloud strikes the ground. This form poses the greatest threat to life and property. In Minnesota, there were 580,378 cloud to ground lightning flashes in 2005 (2).
- Ball lightning is extremely rare and has no known scientific explanation. It is seen in the form of a 20 to 200 centimeter ball (5).
How lightning is formed
Ice in a cloud causes the development of lightning. Ice particles collide as they swirl around in a storm, causing a separation of electrical charges. Positively charged ice crystals rise to the top of the thunderstorm, and negatively charged ice particles and hailstones drop to the lower parts of the storm. Enormous charge differences develop due to the countless numbers of ice particles growing within a developing thunderstorm (5). A moving thunderstorm gathers positively charged particles along the ground that travel with the storm, called the image charge (5). As the differences in charges continue to increase, positively charged particles rise up tall objects such as trees, houses, and telephone poles—and people.
The negatively charged bottom part of the storm sends out an invisible charge toward the ground. When the charge gets close to the ground, it is attracted by all the positively charged objects, and a channel develops. The subsequent electrical transfer in the channel is the visible lightning bolt (5).
Impact of Lightning
 (10)
(10)
Lightning is the second leading source of storm deaths in the United States and in many states lightning is the leading source of weather deaths (3). Of all the lightning related deaths in the United States 28% occur in open fields, 14% under trees, 8% near water, 5% on golf courses, 3% near tractors, 2.5% while talking on corded telephones (5). There are fifty-seven confirmed lightning deaths in Minnesota between 1959-2006 (1). In the United States, there were 3,696 deaths recorded between 1959 and 2003 (7). People struck by lightning suffer from a variety of long-term, debilitating symptoms, including memory loss, attention deficits, sleep disorders, numbness, dizziness, stiffness in joints, irritability, fatigue, weakness, muscle spasms, personality change, depression, and an inability to sit for long. (6) About 10 percent of lightning-stroke victims are killed, and 70 percent suffer serious long-term effects (3). About 400 people survive lightning strokes in the U.S. each year. The odds of becoming a lightning victim in the U.S. in any one year are 1 in 700,000. The odds of being struck in your lifetime are 1 in 3,000. (7) In addition to the visible flash that travels through the air, the current associated with the lightning discharge travels along the ground. Although some victims are struck directly by the main lightning stroke, many victims are struck as the current moves in and along the ground. Lightning can strike in the same place twice. Tall buildings and monuments are frequently hit by lightning, causing damage to buildings (6).
Occurance
 (2)
(2)
Lightning detection systems in the United States monitor an average of 25 million strokes of lightning from clouds to ground during +100,000 thunderstorms every year. (7) On average, lightning flashes occur on earth about 100 times every second. 80% of these flashes are in-cloud and 20% are cloud-to-ground (3). Lightning strikes in Minneapolis occur mainly during the summer months. In Minneapolis, lightning can also occur during heavy snow storms.
Facts
If your hair stands up in a storm, it could be a bad sign that positive charges are rising through you, reaching toward the negatively charged part of the storm. This is a sign that lightning is about to strike (5).
Use the 30-30 rule, when visibility is good and there is nothing obstructing your view of the thunderstorm. When you see lightning, count the time until you hear thunder. If that time is 30 seconds or less, the thunderstorm is within six miles of you and you should seek shelter immediately (6).
The Fourth of July is historically one of the most deadly times of the year for lightning in the U.S. In summer, especially on a holiday, more people are outside, on the beach, golf course, mountains, or ball fields (3).
 (4)
(4)
Case Study #1
According to KARE 11 TV, a local Minneapolis television station, a series of severe storms swept through the Minneapolis area on September 21, 2007. The Sheriff John Sanner said four homes were struck by lightning in the area and at least one had extensive smoke damage (8).
#2 Lightning Strike in Minneapolis (9)
http://youtube.com/watch?v=E4x11IDB-2o&feature=related
5) Rauber, Robert M., John E. Walsh, and Donna J. Charleviox. Severe & Hazardous Weather: an Introduction to High Impact Meteorology. Dubuque: Kendall/Hunt, 2005. 360-371.
Tornadoes
Kristia Pyka
Minnesota is the furthest northern state that is considered to be a part of Tornado Alley [1]. The boundary of Tornado Alley just covers Minneapolis, so one can say that the city can expect more frequent tornadoes than its surrounding area. The state of Minnesota saw an average of 21 tornadoes a year from the years 1961-1990, which resulted in an average of 1 death per year [2]. Although tornadoes have occurred in Minnesota in every month from March through November, nearly 75% of all tornadoes occur in the months May, June, and July [1]. This is especially true of Hennepin County, which Minneapolis is part of (See below [3]).
Hennepin County Tornadoes
Date Event Time Dead Inj F County
# Scale number(s)
JLY 20, 1951 003 2100 5 40 F3 053
JUN 23, 1952 002 2330 0 5 F2 053
AUG 02, 1963 005 0230 0 0 F1 053 123
MAY 06, 1965 008 1815 0 88 F4 053
MAY 06, 1965 013 2014 6 50 F4 053
JLY 05, 1966 012 2047 0 0 F2 053
JLY 15, 1969 006 1520 0 0 F0 053
MAY 22, 1979 002 1455 0 0 F2 053
JUN 28, 1979 017 1815 0 0 F1 053
JUN 14, 1981 012 1449 0 23 F3 053
JUN 13, 1983 006 2000 0 0 F0 053
APR 26, 1984 003 2033 1 52 F3 053
JLY 16, 1984 019 1500 0 0 F1 053
JLY 18, 1986 016 1547 0 0 F2 053
JLY 23, 1987 016 1747 0 0 F3 053
MAY 30, 1991 010 1420 0 0 F0 053
MAY 30, 1991 011 1430 0 0 F0 053
JLY 21, 1995 011 1834 0 0 F0 053
JLY 21, 1995 012 1835 0 0 F1 053
The development of a tornado begins before a thunderstorm even develops when there is a change in wind direction and an increase in wind speed [2]. This then creates a horizontal spinning effect which is invisible and located within the lower atmosphere [2].
 [2]
[2]
Rising air found in the thunderstorm tilts so that the rotating air goes from horizontal to vertical [2].
 [2]
[2]
The final result of this is an area of rotation 2-6 miles wide and it is the area where most strong tornadoes form [2].
 [2]
[2]
One unique aspect of a specific rash of tornadoes that went through the Twin Cities in 1965 is that they caused more dollar damage than any single weather event in Minnesota history [4]. Another unique aspect of tornadoes in Minneapolis is that city is considered a part of Tornado Alley, which is an area that consistently experiences high numbers of tornadoes each year [5]. As seen in the image below, Tornado Alley is an area of the country where numerous airmasses collide, which lends itself to supercell formation and eventually tornadoes.
 [5]
[5]
The lasting impacts of tornadoes in Minneapolis are mostly of a social or economic basis and include damage or destruction of buildings, loss of trees and landscaping, damage or destruction of automobiles and all forms of public transportation, and also disruptions to utilities and services (power, telephone/internet, water) [6].
Case Study: May 6th, 1965 A.K.A. The Longest Night
Kristia Pyka
 [8]
[8]
On May 6th, 1965, six tornadoes swept through the Twin Cities. This event retains the fifth spot on a list of the most important weather events of the 20th century in Minnesota [7]. Five of these tornadoes went across the western and northern portions of a total of 7 counties, while the sixth tornado stayed just outside the metropolitan area [7]. For two hours and six minutes, four F4 tornadoes, one F3 tornado, and 1 F2 tornado tore through this 7 county region doing their worst [9]. At 6:08 PM, the first tornado touched down just east of Cologne [8]. This F4 tornado was on the ground for 13 miles before it finally dissipated in a northwestern part of Minnetrista after killing 3 and injuring 175 [8]. The next tornado was also an F4 and it touched down at 6:27 PM near Lake Susan in Chanhassen [8]. It was on the ground for 7 miles and traveled directly north to Deephaven, but it caused no injuries or fatalities [8]. The third tornado, an F3, touched down at 6:34 PM about 3 miles east of New Auburn [8]. It traveled 16 miles and moved just west of Lester Prairies, but it caused no injuries or fatalities [8]. Tornado number 4 touched down 2 miles east of Green Isle at 6:43 PM and traveled for 11 miles [8]. This F2 killed 1 person and injured 175 before dissipating about 2 miles southwest of Waconia [8]. The fifth tornado touched down at 7:06 PM in southwest Fridley and killed 3 people and injured 175 [8]. It was the third F4 and it was on the ground for 7 miles before dissipating northeast of Laddie Lake in Blaine [8]. The last tornado, the final F4, touched down at 8:14 in Golden Valley [8]. It moved across northern Minneapolis, into Fridley, then Mound View, before finally dissipating west of Centerville [8]. The last tornado was the deadliest, killing 6 and injuring 158 on its 18 mile trek [8]. Below is a picture of the six tornadoes tracks.

[10]
The Meteorology that Day
That day the temperature was in the upper 70s and there were high dewpoints [11]. This was and still is pretty unusual for Minnesota and it was the first ingredient for a thunderstorm. Adding to this unusual occurrence was a strong upper level system moving into Minnesota from the southwest and a slow-moving cold front [11]. Because of these obvious signs of at the very least some heavy thunderstorms, the U.S. Weather Bureau knew what they were looking at and when the time came, they were able to give warning to the cities being affected.
Was this typical for Minneapolis?
Although, as stated above, Minneapolis is a part of Tornado Alley, in the 30 years that followed this outbreak of tornadoes, there were no other F4 tornadoes to touch down [3]. So, tornadoes of the huge magnitude that were seen on May 6th, 1965 were definitely not typical for Minneapolis or for the county of Hennepin.
Was it well forecast?
The tornadic activity of that day was very well forecast. The number of people killed would have dramatically increased if not for the warnings from the U.S. Weather Bureau [7]. For the first time in Twin Cities history, the cities were ordered to use the civil defense sirens to warn the citizens of the severe weather [7]. After it was forecast, one group which is credited with saving numerous lives is WCCO, an AM radio station broadcast out of the Twin Cities [7]. Also, other help with forecasting and warning the citizens came from other local radio and television stations and the local officials were credited with excellent communications through these six tornadoes [7]. Below is a radar picture from 6:45 PM that day.
 [12]
[12]
What implications did it have on Minneapolis and the surrounding area?
The implications of theses six tornadoes on Minneapolis and the surrounding area were huge. In the aftermath, there was 51 million dollars in damage in Minnesota, 13 people were killed, and 683 people were injured [11]. There were damaged homes and buildingseverywhere in the 7 counties and the Governor called the National Guard to search for bodies in the rubble [11]. In the town Fridley alone there were over 450 homes destroyed, 6 people were killed, and 180 were injured [9]. Below are pictures of the destruction left behind by the six tornadoes.

[8] The National Guard searching the damage in the Twin Cities

[8] Farmstead 2 miles southwest of Waconia

[11] Mailboxes of destroyed homes that were left untouched
Inset: A pool ball wedged on an electrical line pole

[8] Aerial view of Louisa Drive in Mounds View
[8] Destruction caused by the first Fridley tornado. In the foreground are personnel
of the U.S. Weather Bureau talking to a Fridley resident. The third man from the
left is Phillip Kenworthy, the Meteorologist-in-charge of the Twin Cities office. Across
the street in the blue car, two women sat through the tornado while it blew out the
windows.
[1] http://climate.umn.edu/doc/historical/tornadic.htm
[2] http://www.nssl.noaa.gov/edu/safety/tornadoguide.html
[3] http://www.tornadoproject.com/alltorns/mntorn.htm
[4] http://members.aol.com/vortex100/end.htm
[5] http://www.nssl.noaa.gov/primer/tornado/tor_climatology.html
[6] http://kyclim.wku.edu/BRADD/tornadoes/socecon.html
[7] http://minnesota.publicradio.org/display/web/2008/03/27/tornadoweather/
[8] http://www.crh.noaa.gov/mpx/HistoricalEvents/1965May06/index.php
[9] http://en.wikipedia.org/wiki/Twin_Cities_Outbreak#cite_note-vortex-0
[10] http://www.crh.noaa.gov/mpx/HistoricalEvents/1965May06/images/RevisedTracks.jpg
[11] http://members.aol.com/vortex100/part2.htm
[12] http://www.crh.noaa.gov/mpx/HistoricalEvents/1965May06/images/radar/1965May06_1845.jpg
Heat Waves
Ryan Dailey
Although Minnesota is more well known for its winter snow storms, heat waves have played a significant role in its history, especially in the last 10 years. Heat Waves are characterized by prolonged periods of excessively hot weather that is often accompanied by high humidity. In the United States, a typical heat waves is defined by having three days where the average temperature for five consecutive days is nine degrees higher then the historical period. [1]


[3]
What causes a drought?
The main key atmospheric clues to a drought are “large-scale upper-air waves, the jet stream, and subtropical high-pressure systems” that are a departure from normal patterns. In the central United States where Minneapolis, Minnesota is located droughts are caused when a high-pressure center develops aver the interior U.S. Normally during the summer months the jetstream will occasionally come down from Canada and onto the U.S. bringing much needed rain. The problem is when there is a high-pressure system is it keeps the jetstream north. Jetstream also signifies clear skies, therefore a lack of rain. [2]
Frequency
Heat Waves in the Minneapolis-St.Paul area of Minnesota, as well as with most of the continental United States, typically occur in the summer months of June, July, and August. Since 1990, there have been three major heat waves that have affected Minneapolis.
-In July of 1995, a heat wave reaching temperatures of over 100 degrees struck and left two people dead.
-In 1999, two separate heat waves three days apart struck and left two people dead.
-In 2001, the worst heat wave to strike Minnesota area left 11 people dead.
Although not very common in Minneapolis, deadly heat waves do occur, on average, once every six years. With global temperatures rising and the increasing costs of electricity, this number is expected to continue to rise. [2]
Meteorlogical Development
Heat Waves occur in high pressure areas where there is little rain or cloud cover, which protects the ground from excessive heating. When the high pressue air becomes trapped by the jetstream, the air continues to heat and a heatwave persists. When the jetstream does not move quickly during the summer months because of the lack of wind, the sun heats the air over a particular area for a longer period of time then normal. Although humidity does not affect the definition of a heat wave, the intensity of the heat wave can be affected by high humidity because it slows the evaporation of sweat from the skin glands, which is the process by which the human body cools. The table below shows how temperature and relative humidity can influence how the human body reacts to extreme heat and humidity that accompany heat waves.

 [3]
[3]
Lasting Impacts of Heat Waves
Even though Minneapolis is more well known for its cold, snowy winters then it is for the heat that accompnay the summer months, heat waves are an integral part of the Minneapolis' climate. Each year, people die from heat related complications that could be easily avoided if they were educated on the dangers of excessive heat. In the future, I believe that people will take Heat Advisories and Excessive heat warnings provided by the National Weather Service more seriously because the media has been doing a better job explaining how to beat the heat.
[1] http://climate.umn.edu/doc/journal/nov99heat.htm
[2] http://www.ci.buffalo.mn.us/police/Heat%20Waves.htm
[3] http://www.nws.noaa.gov/om/heat/index.shtml
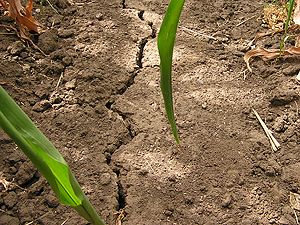
Drought ndohert2


[6]
Natural hazards are not always to something happening, but rather the lack of something, such as a lack of rain which leads to a drought. A drought is a time when there in not enough moisture in the soil, occurring most of the time when more water is removed from the soil than in put into it.[1] There is no definition for drought, because what may be normal dry weather for some areas may be considered a drought for others, so it is more a measurement of the moisture to what is normally seen. [2] Droughts are a threat to human life when occurring in agricultural areas, causing damage to crops which leads to food shortage, increase food prices, and sometimes even famine. [1] They lead to the more fatalities than other andy weather related issues. [2]They are also bad because they deplete the drinking water people have. Droughts are much worse in developing countries, often leading to famine, disease, and political conflict. Droughts can also be responsible for wild fires due to the dryness of the ground, resulting in destruction of property. “Droughts caused at least $1 billion in crop damage per year in the U.S. for nine of the 25 years between 1980 and 2005.” With the threat of global warming droughts are thought to increase in years to come. [1]
Measuring a Drought:

The “Dust Bowl”: one of the worst weather events of the twentieth century
 Minnesota Farmer with dry soil [4]
This was the longest drought in U.S. history, lasting from the 20’s to the late 30’s. In the year 1931 the summer was extremely dry and there was no relief to follow. The continual dry summers allowed for the wind to kick up dust, making agriculture increasingly hard terming the name “Dust Bowl”. Using the Palmer Drought Severity Index (PDSI) the “Dust Bowl” saw conditions that were even greater than the scale, at -5, -6, -7, and even -8 at the worst. [2]
Minnesota Conditions:
 [5]
[5]
United State Drought Outlook
[5]
According to this chart Minneapolis, Minnesota should not be affected by drought conditions this year.
[1] http://www.naturalhazards.org/investigate/drought/index.html
[2] Rauber, Robert M., Walsh, John E., Charlevoix, Donna J. Severe and Hazardous Weather. Kendall/Hunt Puclishing Company, Dubuque, Iowa. 2005
[3] http://www.cpc.ncep.noaa.gov/products/analysis_monitoring/regionalmonitoring/palmer.gif
[4 ] cimate.umn.edu/doc/journal/top5/numberone.htm
[5] http://www.drought.noaa.gov/
[6] http://images.publicradio.org/content/2006/07/27/20060727_cracks_2.jpg
Impact of Hail
Lora Moore, llmoore2
Frequency
Hail may fall during the occurrence of a severe thunderstorm. Thunderstorms hit Minneapolis, MN 45 days out of one year, and 80% of these thunderstorms occur during the heavier and more severe rainfall months. This is where hail has the potential to form and can cause much damage to this area, especially when there is strong likeliness for a tornado. I would specify that the frequency of hail would be greater in the event of a tornado, which has the strongest occurance in June. July places second in severity of storms and then May. Although much hail has the potential to fall during the “tornado season,” reports of actual hail occurrences show that hail only falls three to four days annually. These reports also show they generally range from being pea-sized to dime- sized. Golf ball sized hail is very rare, occurring once or twice a year.
Assorted Hailstones (Credit: NOAA Photo Library)


Meteorological Aspect
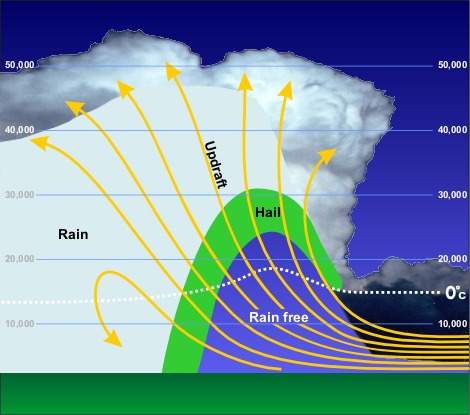
Meteorologically, hail develops within a thunderstorm when strong flows of air rise. These currents carry water droplets up, and as they move upward, these small drops gradually increase in size, which is the beginning formation of hail pellets. When these droplets grow to a size that is impossible for the updraft to carry and support, they fall in this atmosphere as hail. Below is an illustration to better understand what occurs during an updraft.
To actually fall as hail, these frozen droplets, also called graupel have to accumulate more ice in the process; this process is called accretion. To visually demonstrate this process of accretion, refer to this aid:
Process of accumulating additional ice: Accretion

Interesting Fact
Although Minneapolis has only seen relatively smaller sized hail, and only up to golf ball size, hail can amazingly grow to the size of a grapefruit depending on the immense amount of supercooled droplets involved in a supercell thunderstorm!
Aggregate grapefruit-size hailstone, diameter approx. 15 cm (6 inches).
Credit: NOAA Photo Library
Memorable Impact
Minneapolis experienced a weather event including hail in July 24, 2006. This day is memorable to residents there because of the unique aspects the storm had and the lasting impacts it had on their lives. In the unstable warm air on a summer afternoon around 2:00pm serious thunderstorms broke out in this area. By 5:30 PM, there were reports of large, golf ball sized, damaging hail that had a huge impact on those in the area of Minneapolis, as the rainfall measured at 1.75 inches over the course of three hours. Places just outside of Minneapolis got over 5 inches of rainfall. Below is a Doppler radar image from this damaging storm.
Notice the high intensity of rain and hail of this storm in Minneapolis. To residents this is a relatively rare, yet memorable storm to that occurred and created golf ball size hail at the University of Minnesota within minutes after this image was taken.
Floods

Flooding is something people living in Minneapolis are use to. Minneapolis history of floods goes back to 1987. On July 23, 1987, there was record breaking rainfall in hours. Meteorologist reported eight inches of rain in four hours, which broke the precious record 7.8 in 1892. The flooding destroyed the whole area. People were stranded with no exit; the bridges were knocked down, hundreds of houses were destroyed, and roads no longer existed. Those who tried to leave had little or no success as the water just swallowed their cars. Students from the local high school were forced to leave before the school caved in. Fortunately, only two people lost their lives, one drowned in his car and another he is basement.

Most of the flooding happens in the spring and summer, after the winter snow melts and turns into rain, but can also happen in the fall. This is a news headline I read, “A soaking October surprise; HEAVY STREET FLOODING; "Three months of rain" - up to 5 inches - fell in the metro area, flooding roads and basements; EXPECT SLOW MORNING COMMUTE; Forecasters say an additional 3 inches could fall this morning, potentially snarling traffic”. “McKinney, Matt; Medcalf, Chao Xiong Myron P”.
The weather in Minneapolis is so unpredictable and can happen anything, people that live here should expect the worst every time rain is reported.

http://images.search.yahoo.com/images/view?back=http%3A%2F%2Fimages.search.yahoo.com%2Fsearch%2Fimages%3Fp%3DMinneapolis%2Bflood%26ei%3DUTF-8%26fr%3Dyfp-t-501%26xargs%3D0%26pstart%3D1%26b%3D21%26ni%3D20&w=800&h=526&imgurl=deckernet.com%2Fminn%2FFlood2001%2FJpeg800%2FFlood2-800.jpg&rurl=http%3A%2F%2Fdeckernet.com%2Fminn%2FFlood2001&size=59.1kB&name=Flood2-800.jpg&p=Minneapolis%20flood&type=JPG&oid=e00e227050a5b11e&no=32&tt=187
http://mwmo.info/content/it-was-%2526%2523039%3Brainfall-century%2526%2523039%3B
http://www.flickr.com/photos/seventyeleventy/448009009/
http://www.highbeam.com/doc/1G1-137244050.html
http://www.srh.noaa.gov/oun/papers/overpass/slide19.jpg
[17] Professor Eric Snodgrass, February 28, 2008, Atmos 120: Severe and Hazardous Weather, Blizzards in the North Central United States


Comments (0)
You don't have permission to comment on this page.